C++ development setup in 2024
Published by Danny van Kooten on .
I’ve been doing a lot of C and C++ programming lately. After trying a range of editors and related tooling, I have settled on a setup that is fast, reliable, and powerful.
This post walks through that C++ development setup: Sublime Text 4 with clangd, compiler flags, clang-tidy, clang-format, and perf.
Editor: Sublime Text
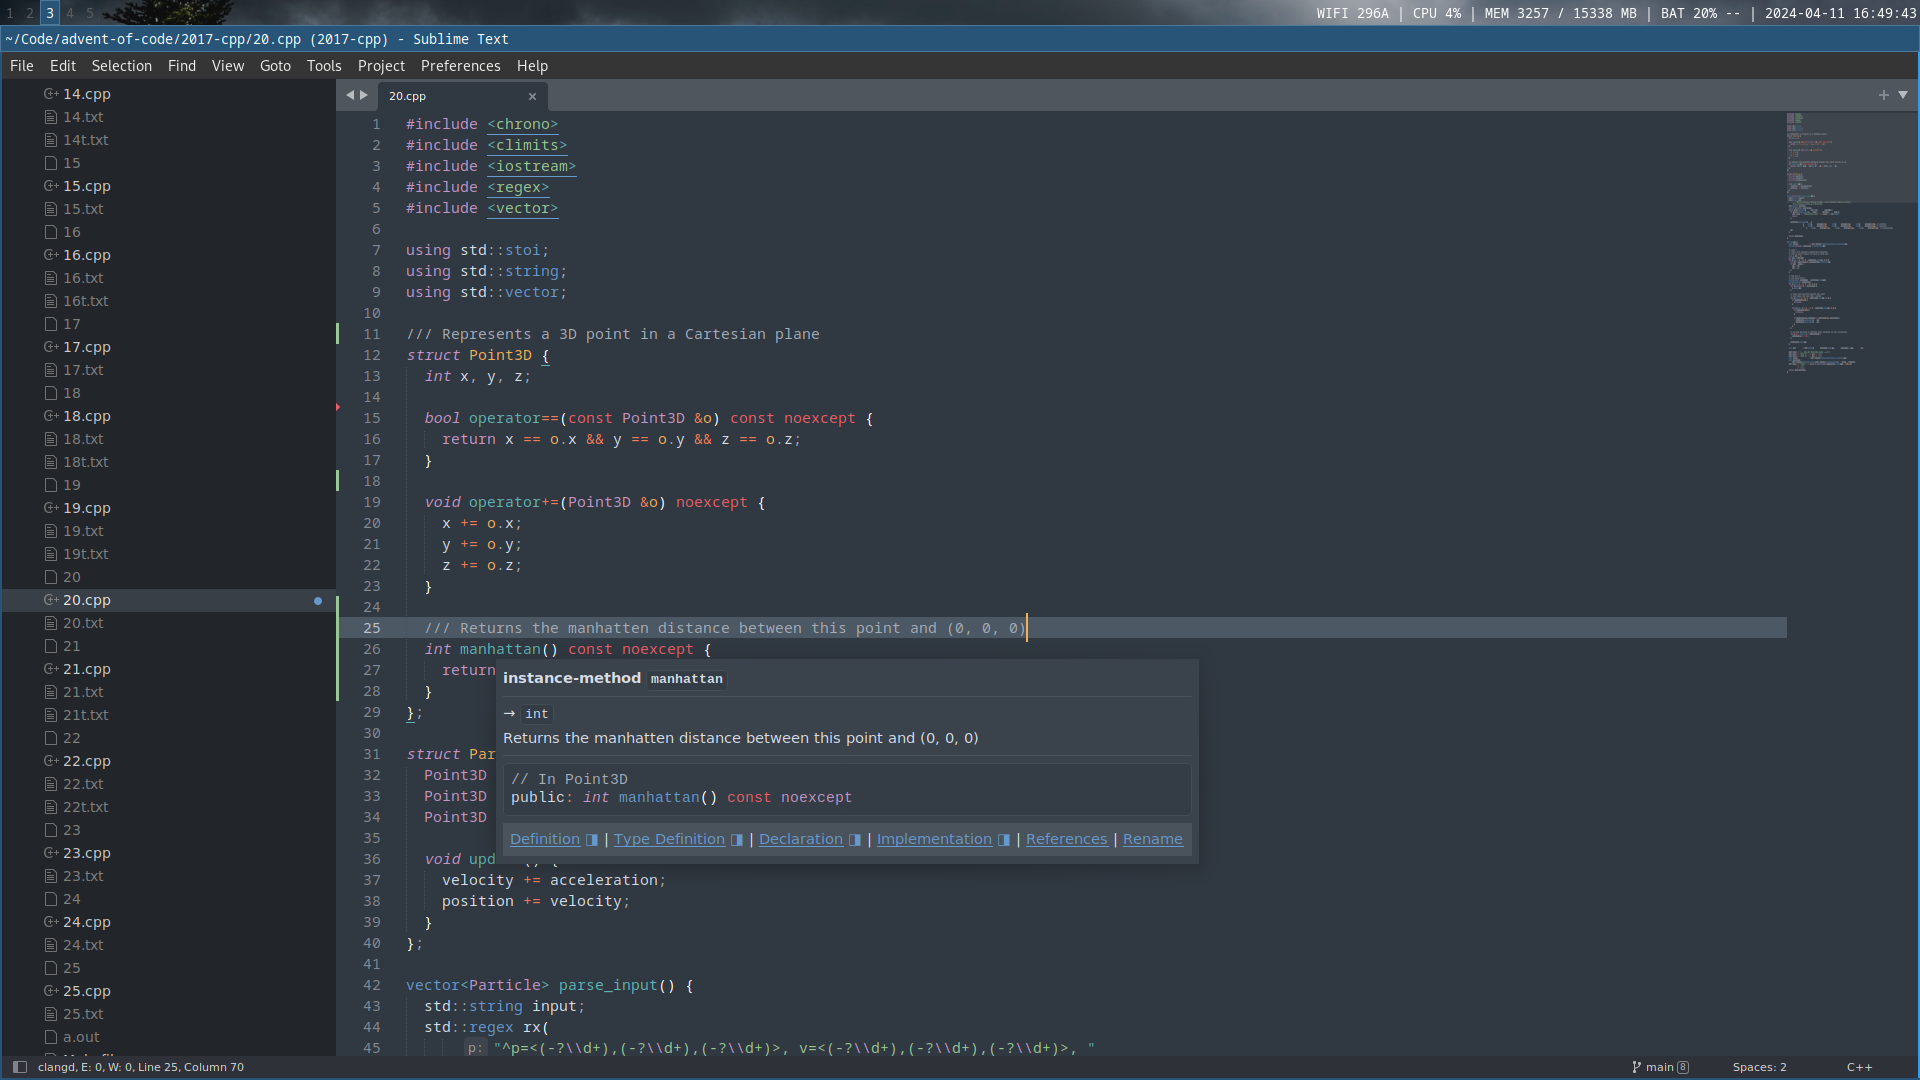
The two most popular options right now are probably VSCode and CLion, yet I found neither of them performant or reliable enough for my taste. Instead, I use Sublime Text 4 in combination with its Language Server Protocol implementation and Clangd.
Why Sublime?
- It’s an order of magnitude faster than both CLion and VSCode.
- It doesn’t suffer from random crashes on large projects.
- It’s easy to configure by modifying JSON config files.
- It works without hours of configuration. Install LSP and LSP-Clangd through Package Control and you have a powerful editor ready to go.
- It’s much more resource efficient than the alternatives. I can have a large C++ project open while it consumes less than 600 MB of RAM and the CPU sits idle.
The main drawback is that it’s not open source. Still, I like how a small team from Australia can build a small but profitable business around a code editor.
The community for plugins is not as vibrant or active as it once was, but everything I need is there.
Configuring Clangd
Clangd works with Sublime Text through LSP-clangd out of the box, but a few settings are worth configuring.
First, enable background indexing explicitly.
- Go to Preferences > Package Settings > LSP > Servers > clangd.
- Ensure
initializationOptions["clangd"]["background-index"]is set totrue:
{
   "initializationOptions":{
      "clangd.background-index":true
   }
}
To let Clangd know how to build your project, you can use several methods:
- A
.clangdYAML file in your project root containing aCompileFlagskey.CompileFlags: Add: [ -std=c++20, -Wall, -Wextra, -Wconversion ] - A
compile_flags.txtfile containing one flag per line.-std=c++20 -Wall -Wextra -Wconversion - A
compile_commands.jsonfile. You can have this file generated by CMake by setting theCMAKE_EXPORT_COMPILE_COMMANDSenvironment variable.
Compiler flags
My workstation runs Debian, so I tend to compile the C and C++ projects I work on using whatever version of GCC and Clang is in the official package repositories.
Currently, this means GCC 12 and Clang 14, both of which have near-complete support for -std=c++20 ^1.
When a newer compiler is needed, there’s always building GCC from source or LLVM’s APT repositories.
Both GCC and Clang are conservative with warnings, so it is worth enabling some of them explicitly. The group of warnings from -Wall and -Wextra is what I always enable as a baseline ^3.
For compilation profiles, I tend to use three:
Development
Development mode mostly cares about fast compilation times. The LDFLAGS environment value instructs the compiler to use mold for the linking stage, which is usually an order of magnitude faster than ld.
CFLAGS="-std=c11 -Wall -Wextra -Wvla -Wformat -Wformat=2 -Wconversion -Wdouble-promotion -g"
CXXFLAGS="-std=c++20 -Wall -Wextra -Wconversion -g"
LDFLAGS="-fuse-ld=mold"
Debug
In debug mode, we want debug symbols, stack traces, and runtime checks from both Address Sanitizer and Undefined Behavior Sanitizer.
CFLAGS="-g -fsanitize=address,undefined -fno-omit-frame-pointer"
CXXFLAGS="-g -fsanitize=address,undefined -D_GLIBCXX_ASSERTIONS -fno-omit-frame-pointer"
ASAN_OPTIONS="strict_string_checks=1:strict_memcmp=1:quarantine_size_mb=512:detect_stack_use_after_return=1:check_initialization_order=1"
UBSAN_OPTIONS="print_stacktrace=1"
-D_GLIBCXX_ASSERTIONS adds runtime bound checks for C++ containers from the STL. There is also -D_FORTIFY_SOURCE=2, which adds runtime buffer overflow detection for a collection of functions from glibc, but it requires an optimization level of 1 or higher (-O1).
ASAN_OPTIONS is used to configure Address Sanitizer so it can use more memory for detecting use-after-free errors and perform some stricter checks that are disabled by default.
UBSAN_OPTIONS is used alongside -fno-omit-frame-pointer to configure Undefined Behavior Sanitizer to print a symbolized stack trace for each error report.
Release
In release mode, we want the compiler to produce the fastest code possible at the cost of longer compilation times.
CFLAGS="-O3"
CXXFLAGS="-O3"
If you don’t care about portability and want to target your specific CPU, you could add -march=native and -mtune=native.
Diagnostics: clang-tidy
Since we use Clangd as our language server, we can instruct it to emit diagnostics beyond compiler warnings through clang-tidy.
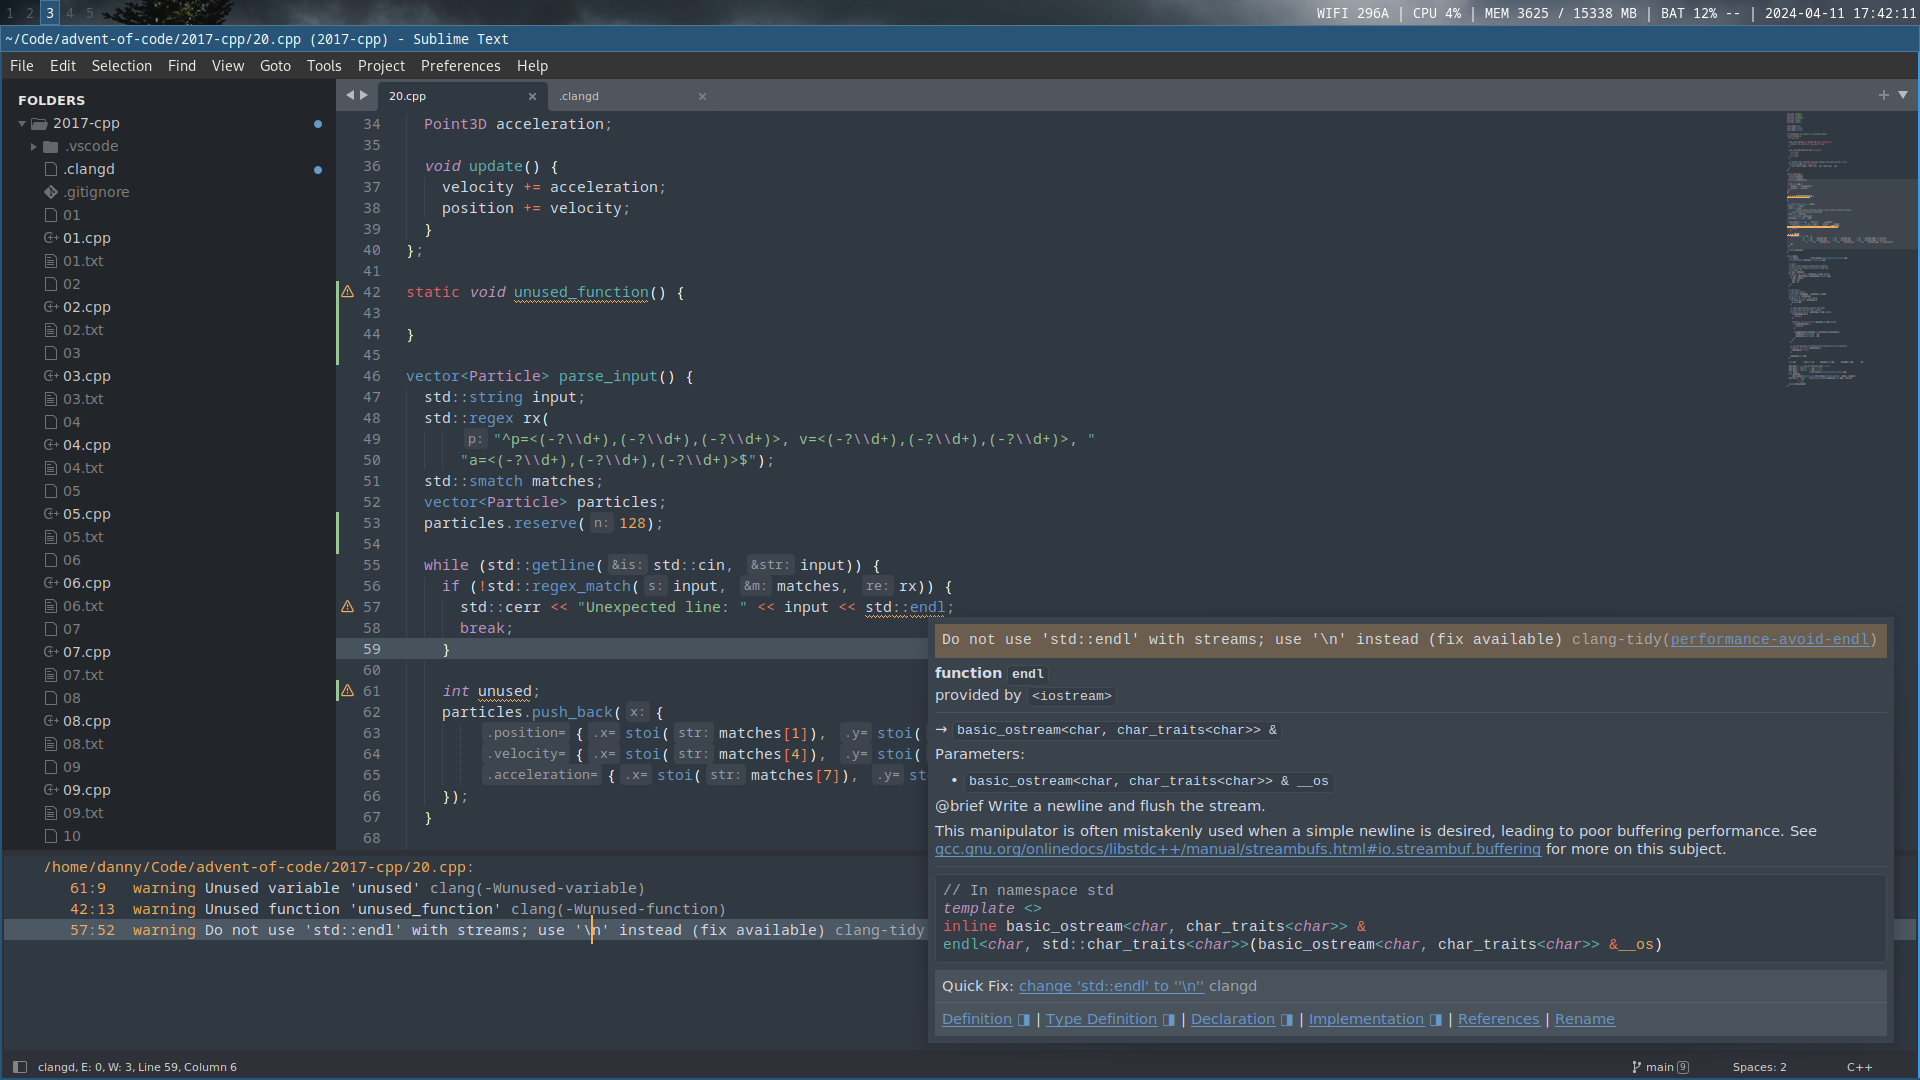
clang-tidy is disabled by default, but you can enable it by modifying the settings for the LSP-clangd plugin.
- Go to Preferences > Package Settings > LSP > Servers > Clangd.
- Ensure
initializationOptions.clangd["clang-tidy"]is set totrue
{
   "initializationOptions":{
      "clangd.clang-tidy":true,
      "clangd.background-index":true,
      "clangd.header-insertion":"iwyu",
      "clangd.completion-style":"detailed"
   }
}- You can configure clang-tidy by creating a
.clangdYAML file in your project root. In it, you can add or remove the clang-tidy checks you want. I mostly stick to the ones fromperformance-*andcppcoreguidelines-*.
Diagnostics:
    ClangTidy:
        Add:
        - performance-*
        - cppcoreguidelines-*
        Remove:
        - cppcoreguidelines-avoid-magic-numbers
The LLVM suite also contains a run-clang-tidy command, which you can use to run a single check against your source directory:
run-clang-tidy -checks='-*,performance-unnecessary-value-param' src/Formatter: clang-format
We can use clang-format through Sublime’s LSP-clangd plugin.
Go to Preferences > Package Settings > LSP > Settings and ensure lsp_format_on_save is set to true.
Your code style can be configured through a .clang-format YAML file in your project root.
Profiling: perf
To find performance bottlenecks, I have not come across anything that beats perf together with flamegraph.pl.
The author of flamegraph.pl has a useful post with many language-specific tips on how to create flamegraphs from a perf report.